
Denial Rate Calculator + Root-Cause Analysis Worksheet
A denial rate becomes useful when it shows where cash is breaking, why claims are failing, and which defects can be prevented before the next billing cycle. A single percentage cannot do that alone. Practices need consistent calculations, dollar-based exposure, CARC/RARC analysis, and ownership by root cause. Teams working with claim adjustment reason codes, denial-management workflows, electronic claim submission, and medical billing fundamentals can use this guide to calculate denial rates accurately and convert every denial category into a measurable prevention plan.

1. Calculate Your Medical Billing Denial Rate the Right Way
Start by deciding which denial rate you are measuring. Organizations often compare percentages calculated from different denominators and then draw the wrong conclusion.
HFMA's remittance denial rate uses:
Denial Rate = Actionable Claims Denied ÷ Total Claims Remitted × 100
Its MAP Key treats actionable denials as claims that can potentially be addressed and corrected to obtain appropriate reimbursement. The definition includes zero-payment and partial-payment remittances containing a denial indicator while excluding categories such as patient-responsibility adjustments, duplicate claims, and certain non-actionable items.
Suppose a physician practice receives remittances for 8,000 claims, and 640 meet its standardized actionable-denial definition:
640 ÷ 8,000 × 100 = 8% denial rate
For teams studying medical billing concepts, comparing medical billing and coding careers, working through CBCS preparation, or managing insurance denials, the denominator matters as much as the numerator.
Also calculate initial denial rate separately. HFMA's standardized claim-integrity framework defines an initial-denial metric around the first denial associated with a claim and recommends examining both claim volume and dollars.
Use:
Initial Denial Rate by Volume = Initial Denied Claims ÷ Total Claims Submitted × 100
Then calculate:
Initial Denial Rate by Dollars = Gross Charges on Initially Denied Claims ÷ Gross Charges Submitted × 100
The dollar calculation catches something claim count can hide. Fifty denied $60 claims carry much less exposure than ten denied $15,000 claims. Practices reviewing physician reimbursement, Medicaid reimbursement, ambulance reimbursement, and workers' compensation billing should therefore track volume and financial exposure together.
Finally, calculate denial write-off rate:
Denial Write-Off Rate = Net Dollars Written Off as Denials ÷ Net Patient Service Revenue × 100
That distinguishes claims temporarily stuck in a denial workflow from reimbursement that ultimately becomes permanent leakage. HFMA identifies denial write-offs as a separate KPI for exactly this reason.
| Denial Root Cause | Evidence to Review | Likely Owner | Prevention Action | Metric to Track |
|---|---|---|---|---|
| 1. Incorrect member ID | Eligibility response vs registration | Front desk | Real-time eligibility validation | ID-error denials per 1,000 claims |
| 2. Patient-name mismatch | Member card and payer record | Registration | Exact payer-name matching | Demographic denial rate |
| 3. Inactive coverage | Eligibility on date of service | Registration | Reverify near DOS | Eligibility denial rate |
| 4. Wrong payer billed | Coverage chronology | Registration/billing | Payer-order verification | Wrong-payer claims |
| 5. COB incorrect | Primary EOB and COB data | Billing | Update COB before submission | COB denial dollars |
| 6. Authorization absent | Payer requirement and auth log | Scheduling/auth team | Pre-service auth hard stop | No-auth denial rate |
| 7. Authorization expired | Approved date range | Authorization team | Expiration alerts | Expired-auth denials |
| 8. Units exceed authorization | Approved vs consumed units | Clinical/auth team | Unit countdown | Denied units |
| 9. Referral missing | Plan requirements | Scheduling | Referral verification | Referral denials |
| 10. Timely filing exceeded | Submission and acceptance history | Billing | Aging alerts | Claims nearing filing limit |
| 11. Invalid diagnosis | DOS-specific ICD-10-CM set | Coding | Annual code updates | Diagnosis edit failures |
| 12. Diagnosis lacks specificity | Clinical note | Provider/coding | Documentation improvement | Unspecified-code rate |
| 13. Diagnosis/procedure mismatch | Assessment and service billed | Coding | Prebill validation | Mismatch denials |
| 14. Invalid CPT/HCPCS | Procedure note and code set | Coding | Date-specific code validation | Procedure-code denials |
| 15. Modifier missing | Documentation and payer rules | Coding | Modifier-specific edits | Modifier denial rate |
| 16. Modifier unsupported | Procedure circumstances | Coding | Coder education/audit | Unsupported modifier findings |
| 17. NCCI bundling | Current edit and operative note | Coding | Prebill NCCI review | Bundling denial rate |
| 18. Units exceed limits | Dose, time, quantity and MUE | Coding/charge capture | Unit reconciliation | Unit-based denials |
| 19. Wrong place of service | Actual encounter location | Coding/billing | Location-to-POS mapping | POS denials |
| 20. Provider enrollment mismatch | Payer enrollment file | Credentialing | Enrollment reconciliation | Provider-data denials |
| 21. NPI mismatch | Rendering/billing NPI | Credentialing/billing | Provider-master controls | NPI rejection/denial volume |
| 22. Medical necessity failure | Policy vs clinical record | Provider/coding | Pre-service coverage validation | Medical-necessity denial dollars |
| 23. Records incomplete | Payer request vs submitted packet | Clinical/appeals | Documentation checklist | Records-related denials |
| 24. Signature missing | Authentication evidence | Provider | Unsigned-note work queue | Unsigned encounters |
| 25. Non-covered benefit | Benefit policy | Eligibility/front end | Benefit verification | Benefit-denial volume |
| 26. Frequency exceeded | Prior utilization and policy | Scheduling/billing | Frequency checks | Frequency denials |
| 27. Payer-specific rule missed | Payer policy and edit history | Billing/configuration | Payer-specific edit library | Denials by payer |
| 28. Appeal filed late | Denial and appeal dates | Appeals team | Deadline alerts | Lost appeal rights |
| 29. Underpayment misclassified as denial | Contracted vs actual allowed | Payment integrity | Separate variance workflow | Underpayment dollars |
| 30. Same denial repeats after education | Trend by provider/coder/payer | Process owner | Escalate to system redesign | Recurrence after corrective action |
2. Turn the Denial Percentage Into a Financial Leakage Calculator
An 8% denial rate has limited meaning until you know what the denied claims are worth and what eventually happens to them.
Begin with denied-dollar exposure:
Denied Dollar Exposure = Expected Allowed Amount Attached to Denied Claims
Expected allowed amounts are often more operationally useful than billed charges because charge masters can vary substantially from actual reimbursement. Practices already evaluating physician fee schedules, Medicaid rates, ambulance payment, and workers' compensation reimbursement should therefore calculate both standardized gross-charge metrics and internal expected-reimbursement exposure.
Suppose 640 denied claims carry $184,000 in expected reimbursement.
If 70% are ultimately recovered:
$184,000 × 70% = $128,800 recovered
That leaves $55,200 unresolved or ultimately lost, depending on where those accounts sit in the cycle.
Now calculate the overturn rate. HFMA recommends separately tracking how many initial denials are eventually overturned and paid because this shows appeal effectiveness and can reveal problematic payer or denial categories.
Use:
Denial Overturn Rate = Denials Overturned and Paid ÷ Denials Resolved × 100
A very high overturn rate deserves investigation. It may indicate excellent appeals, but it can also indicate that large numbers of claims were initially denied despite being payable. That creates unnecessary labor and cash delay. Teams managing medical billing denials, electronic claims, coding audits, and coding productivity should therefore monitor appeal success alongside preventability.
Next calculate cost of rework:
Monthly Denial Rework Cost = Denied Claims × Average Cost to Resolve One Denial
If 640 denied claims cost an estimated $18 each in staff time and overhead:
640 × $18 = $11,520 in monthly denial rework
A denial eventually paid after four calls, two medical-record submissions, and an appeal still damaged the organization financially. That operational drag contributes directly to the pressure described in medical coding stress, medical coding productivity quotas, outsourcing concerns, and complex revenue-cycle careers.
Finally, distinguish temporary denial exposure from permanent leakage. Unpaid accounts still under valid appeal are not equivalent to accounts written off after appeal rights expire. Your dashboard should keep those populations separate.
3. Use CARCs and RARCs to Find the Real Root Cause
A denial category such as “coding,” “authorization,” or “eligibility” is useful for reporting but still too broad for corrective action.
CMS explains that ERAs use standardized Claim Adjustment Group Codes, CARCs, and RARCs to communicate why payment was adjusted. CARCs give the overall reason for an adjustment, while RARCs can supply additional detail.
That makes the ERA the starting point for structured root-cause work. A strong team should connect each CARC with its accompanying RARC, payer, service, provider, location, and corrective outcome rather than dumping all adjustment codes into a generic denial-management queue.
For example, CARC 29 indicates that the filing time limit has expired, while other codes identify problems involving modifiers, place of service, patient coverage, procedure/diagnosis relationships, provider type, or authorization. The code identifies the symptom; root-cause analysis explains why your organization produced it.
A timely-filing denial might originate from:
an unsigned encounter that sat for 20 days;
a coding queue that was understaffed;
an ignored clearinghouse rejection;
the wrong payer being billed first;
an enrollment problem;
a claim repeatedly held by internal edits;
a corrected claim submitted through the wrong route.
Those six accounts share the same final denial category while requiring six different prevention strategies.
This is why teams working with billing platforms, electronic submission systems, medical coding audits, and professional-fee coding should capture cause, owner, and prevention action, not simply denial type.
Use a five-question root-cause test for every high-volume category:
Where was the first controllable error created?
Which team could have prevented it before claim submission?
Was the problem human, documentation-related, configuration-related, payer-related, or contractual?
Has the exact failure occurred before?
What control would prevent recurrence rather than merely repair the current claim?
CMS continues updating CARC and RARC implementation, including a July 2026 update, so organizations should keep remittance logic current instead of relying on old denial-code spreadsheets. This matters especially for teams handling Medicaid billing, physician reimbursement, medical billing software, and automated electronic claims workflows.
4. Rank Denial Problems by Preventability, Dollars, and Recurrence
Treating every denial equally creates a bad work queue.
A $24 denial with little recovery potential should rarely receive the same manual effort as a $12,000 claim with a correctable authorization or documentation problem. Likewise, a $100 denial that occurs 4,000 times deserves attention because its aggregate impact can exceed the occasional high-dollar account.
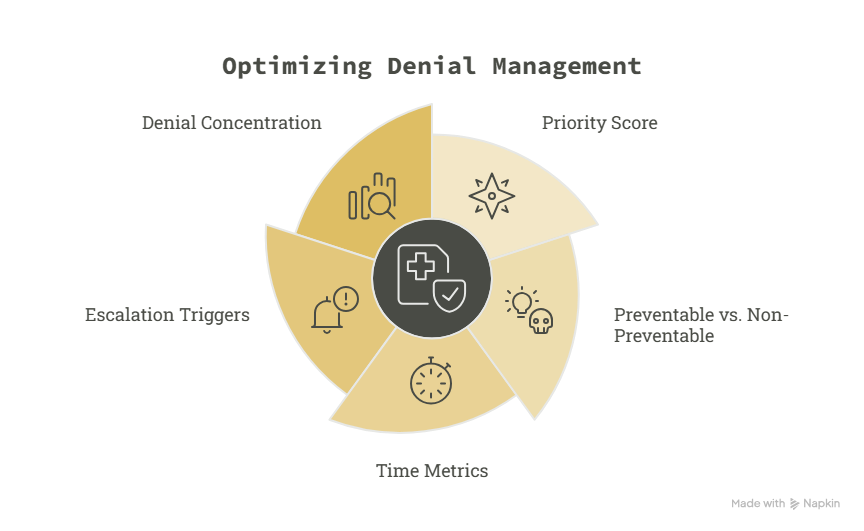
Build a priority score around four dimensions:
Financial exposure: How much expected reimbursement is at stake?
Preventability: Could the organization have stopped the denial before claim submission?
Recurrence: How frequently does the same root cause appear?
Recoverability: How likely is payment after correction, reconsideration, or appeal?
This approach gives more useful direction than asking staff simply to “work oldest first.” Teams managing medical billing denials, analyzing claim adjustment codes, reviewing physician reimbursement, and measuring coding productivity can then allocate effort where it has the greatest return.
Separate denials into preventable and non-preventable populations. A provider failed to obtain authorization, a patient gave outdated insurance information, a payer unexpectedly changed an edit, and a service was contractually excluded are operationally different problems.
Also analyze the time from denial to appeal and time from denial to resolution. HFMA specifically identifies both as useful measures of internal denial-management efficiency.
A highly recoverable denial can become permanent leakage when staff discover it after an appeal window closes. Practices using electronic claim systems, billing solutions, appeal workflows, and coding audit programs should therefore create escalation triggers well before payer deadlines.
Review denial concentration too. If the top five root causes account for 72% of denied dollars, spreading improvement efforts over 30 categories wastes resources. Fix the concentrated defects first.
5. Build a Denial Dashboard That Leads to Prevention
A denial dashboard should show whether the revenue cycle is becoming more reliable, rather than simply proving that staff processed a large amount of work.
At minimum, report:
initial denial rate by claim volume;
initial denied dollars;
denial rate by payer;
denial rate by provider and location;
denial category by CARC/RARC;
preventable-denial percentage;
appeal submission time;
overturn rate;
average days to resolution;
recovered dollars;
denial write-offs;
rework cost;
recurrence after corrective action.
Pair these metrics with clean claim performance, denial-management operations, CARC analysis, and billing-system data.
Then connect each major root cause to an owner.
Eligibility failures belong primarily with front-end registration processes. Authorization failures should reach the scheduling or authorization team. Diagnosis, modifier, NCCI, and unit problems may require CPT coding expertise, stronger professional-fee coding, targeted coder education, or a formal coding audit.
Medical-necessity denials may require provider documentation improvement. Enrollment problems belong with credentialing. Payer-specific failures may require configuration or contracting intervention.
Then remeasure after the corrective action.
If modifier-related denials fall from 410 to 140 claims after education and edit changes, you have evidence the intervention worked. If the rate remains unchanged, more education is unlikely to solve a process or system defect.
CMS also maintains standardized review reason statements for medical-review denials, helping providers identify why reviewed claims were denied or non-affirmed. Organizations handling CPC-level coding, coding interview assessments, risk adjustment, and advanced coding specialties should use those details to improve upstream documentation and coding.
The most useful denial dashboard therefore ends with one question:
Did this denial happen less often after we understood it?
6. FAQs About Denial Rate Calculation and Root-Cause Analysis
-
A commonly used HFMA remittance denial rate is:
Total actionable claims denied ÷ Total claims remitted × 100
HFMA defines the measure carefully, including actionable zero- and partial-payment denials while excluding several categories that would distort the KPI. Practices should document their definition and use it consistently across medical billing reporting, denial management, CARC analysis, and electronic claim workflows.
-
It depends on the metric. HFMA's remittance denial rate uses claims remitted, while its standardized initial denial rate framework uses initial denied claims relative to submitted claims. Label the metric clearly so teams comparing billing performance, claims systems, denial services, and reimbursement results are comparing like with like.
-
Track both. Claim volume measures operational frequency, while dollars reveal financial exposure. Ten high-value denied procedures can matter more financially than hundreds of low-dollar claims. Organizations analyzing physician reimbursement, Medicaid reimbursement, ambulance reimbursement, and workers' compensation reimbursement need both views.
-
A rejection generally occurs before full payer adjudication because the claim fails an intake, data, or processing requirement. A denial occurs after the payer adjudicates the claim and refuses or reduces reimbursement for an identified reason. Separate these populations when reviewing electronic claim submission, billing software, CARC data, and denial-management workloads because they require different preventive controls.
-
Track payer, claim number, DOS, denial date, CARC, RARC, service/code, provider, location, denied dollars, root cause, responsible workflow, preventability, corrective action, appeal status, recovered amount, resolution date, and whether the same failure recurred. That level of detail supports coding audits, denial analysis, claim adjustment analysis, and billing-system improvement.
-
CMS explains that CARCs communicate the general reason for a payment adjustment and RARCs provide additional detail when needed. Use them as the standardized starting point, then investigate the internal process that created the condition. This is much stronger than grouping everything into “payer denied claim,” especially for teams handling CPT coding, professional-fee coding, denial management, and coding audits.
